 DuckSave
A savings chart where
every step is the same
The same amount every time. Nothing climbs, nothing drops, so you always know what to set aside. Of all the savings charts this is the easiest one to keep going. Here are the daily, weekly and monthly tables, and the arithmetic run backwards from whatever total you are after.
here Written by HUMBURRER (ณัฐพล เนี่ยงจิต)
I make DuckSave · Updated 20 November 2026
What a same-amount savings chart is
You put in the same amount every time. $5 a day means $5 every day. $25 a week means $25 every week. No step is heavier than any other, which is what sets it apart from the 52 week chart, where the amount moves every single week.
The clearest advantage is that you always know what to set aside. No chart to check, no arithmetic, one number to remember. And because it is predictable, it is the easiest method of the four to put on an automatic transfer.
Saving $1, $5 or $10 a day: what you end up with
These are the totals when you finish — the daily amount times the number of days.
| Put in per day | After 30 days | After 100 days | After a year |
|---|---|---|---|
| $1 | $30 | $100 | $365 |
| $2 | $60 | $200 | $730 |
| $5 | $150 | $500 | $1,825 |
| $10 | $300 | $1,000 | $3,650 |
| $20 | $600 | $2,000 | $7,300 |
A year counted as 365 days. Interest not included.
The amount most people start at is $5 a day, because it goes missing without being felt, and a year of it comes to $1,825. And $10 a day lands on exactly $1,000 after 100 days, which is the figure people set as a first goal more than any other.
How much a day to reach $1,000?
The arithmetic backwards is easy — divide the target by the number of payments and round up to a clean number. The total lands a little over, which beats coming up short at the end. This table has it worked out already.
| You want | A day (100 days) | A day (1 year) | A week (52) | A month (12) | Actual year total |
|---|---|---|---|---|---|
| $1,000 | $10 | $3 | $20 | $84 | $1,095 |
| $2,000 | $20 | $6 | $39 | $167 | $2,190 |
| $5,000 | $50 | $14 | $97 | $417 | $5,110 |
| $10,000 | $100 | $28 | $193 | $834 | $10,220 |
The last column is a full 365 days at the rounded-up daily amount.
Charts for $5,000 and $10,000
Targets in the thousands work exactly the same way. All that changes is that the daily amount climbs high enough to need real planning.
$5,000 in a year is $14 a day. $10,000 in a year is $28 a day.
If the per-day number starts to feel uncomfortable, switch to weekly or monthly. The money is the same; it is only easier to think about, and easier to tie to the day you get paid. And if it still feels heavy, that means the timeline should stretch, not that the amount should be forced.
Weekly or monthly instead
The weekly table
| Put in per week | After 12 weeks | After 26 weeks | After 52 weeks |
|---|---|---|---|
| $5 | $60 | $130 | $260 |
| $10 | $120 | $260 | $520 |
| $25 | $300 | $650 | $1,300 |
| $50 | $600 | $1,300 | $2,600 |
The monthly table
| Put in per month | After 6 months | After a year | After 2 years |
|---|---|---|---|
| $50 | $300 | $600 | $1,200 |
| $100 | $600 | $1,200 | $2,400 |
| $250 | $1,500 | $3,000 | $6,000 |
| $500 | $3,000 | $6,000 | $12,000 |
What it is good at, what it costs you, and who it suits
Every method has a price. This one does too. Both sides are here so you can choose before you start, rather than find out in month three and quit.
- You always know what to set aside. One number to remember
- You can work the total out in your head: amount per step times number of steps
- It goes on an automatic transfer, because the amount never changes
- The easiest of the four to keep going. No step is unusually heavy
- Stretch or shorten the timeline without redoing the chart
- It does not adapt at all. In a tight month the only options are skip or rewrite
- A good month still saves the same, so you save less than you could have
- It is dull. None of the rise and fall that makes the 52 week chart interesting
- Set the amount too high and you find out in month two, which is already late
- Your pay lands on the same day every month
- You want to set a transfer and forget about it
- You are saving for the first time and do not want anything complicated
- You have quit before because the late payments got too heavy
- You are saving alongside someone else, where an equal amount is easier to agree on
- Your income changes from month to month
- You run a shop or take work by the job, with no reliable payday
- You want to save hard at the start because you are afraid of quitting
- You want the amount to grow as your income grows
The first three on the bottom right are what the other methods are for — an uneven income wants a share of what comes in, and a fear of quitting halfway wants a little less each time. Both are linked at the foot of this page.
The research: why this method fears a gap most
This method makes the prettiest chart to put on a wall, because every box is the same size. Which also means an unticked box is the thing you see first. There is research on exactly that.
They found that once the record shows the streak is broken, people continue less, and the effect depends on how it looks in the record rather than on what the person actually did. It weakens when the broken record can be repaired.
Decide before you start that misses are allowed and that you will tick them in later. Do not let an empty box be the thing that decides whether you keep going.
Read those numbers knowing this
- Neither study looked at saving money. They studied step counts and games in a lab. That is why I write “research on goals” and not “research on saving”.
When you miss a payment
The amount I would start with — $500 in 100 days
If you do not know what number to start at, I would say $5 a day for 100 days, which comes to $500. Small enough to start today without thinking about it, and short enough to prove to yourself that you finish things, before you take on anything bigger.
If you get through those first 100 days, treat the $500 as evidence that you can, and move up to $10 or $20 a day for the next round.
What I made for you
A savings log
you can print
Blank lines to write down every deposit, with a running total so you can watch it grow. Leave it for two months and nothing scolds you, because there are no empty boxes to see.
Let the app count it instead
Or let DuckSave count
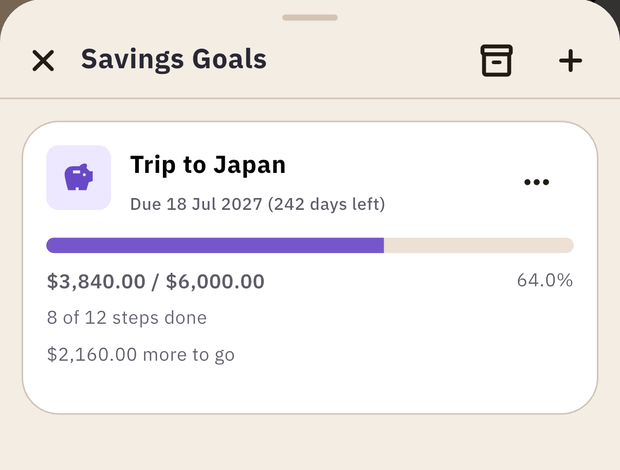
Set a goal and pick Same amount every time, and the app works out the amount per step for you. Change the plan later and the steps you have already ticked keep their money, untouched. Tick one by mistake and you can untick it. Offline. Free, no sign-up needed.
If this one is not for you,
one of the other three may be
All four live in the same app, and you can switch at any time without starting the goal over.
Research cited on this page
- Silverman, J., & Barasch, A. (2023). On or Off Track: How (Broken) Streaks Affect Consumer Decisions. Journal of Consumer Research, 49(6), 1095–1117.
- Sharif, M. A., & Shu, S. B. (2019). Nudging persistence after failure through emergency reserves. Organizational Behavior and Human Decision Processes.
This page is a tool for building a saving habit, not investment advice. Every number here is worked out from the formula by a program and checked, with no interest included. If you find one that is wrong, tell me.